GraphQL Explorer
The GraphQL Explorer uses your live data (including the Preview endpoint). Ensure that changes you make do not disrupt your business.
GraphQL Explorer is a browser-based IDE (Integrated Development Environment) tool that you can use to build and test queries and mutations against your live marketplace data (an implementation of GraphiQL). AppDirect GraphQL Explorer provides:
-
Syntax highlighting
-
Real-time error highlighting and reporting
-
Query execution and result inspection
-
Query history
Use the Endpoint drop-down list to select either the Production or Preview endpoints:
-
Production— The production endpoint exposes all the queries and mutations in Early Availability and General Availability status. See API lifecycle phase.
-
Preview— The preview endpoint exposes all the queries and mutations in the pre-production Preview status. See API lifecycle phase.
Use the GraphQL Explorer
If the AppDirect logo appears in the upper-left corner of the page, when Manage > Marketplace appears in this topic, click the grid icon > Switch to | Store, instead.
Before you can access the GraphQL Explorer and its integrated schema documentation, a Marketplace Manager must enable two marketplace settings (see Enabling GraphQL tools).
When the Explorer is enabled, you can launch it in a separate tab by navigating to Manage > Marketplace > Settings | INTEGRATION > GraphQL Explorer.
You can also access it directly in the browser by entering the URL in the following format:
https://<marketplaceHost>/graphql-explorer
For example:
https://marketplace.example.com/graphql-explorer
On the explorer page, you can select which endpoint to use, either Preview or Production. The elements available to you in the GraphQL Explorer and the schema documentation change depending on your selection.
To add a query or mutation, select the type of item from the Add new drop-down list at the bottom left of the page and click the + symbol beside the list. This adds a new query or mutation which you can then build and test (see GraphQL Explorer window below).
For more information, see GraphiQL documentation.
AppDirect GraphQL Explorer window
The AppDirect GraphQL Explorer window has several sections that provides you with additional information and quick access to GraphQL functionality.
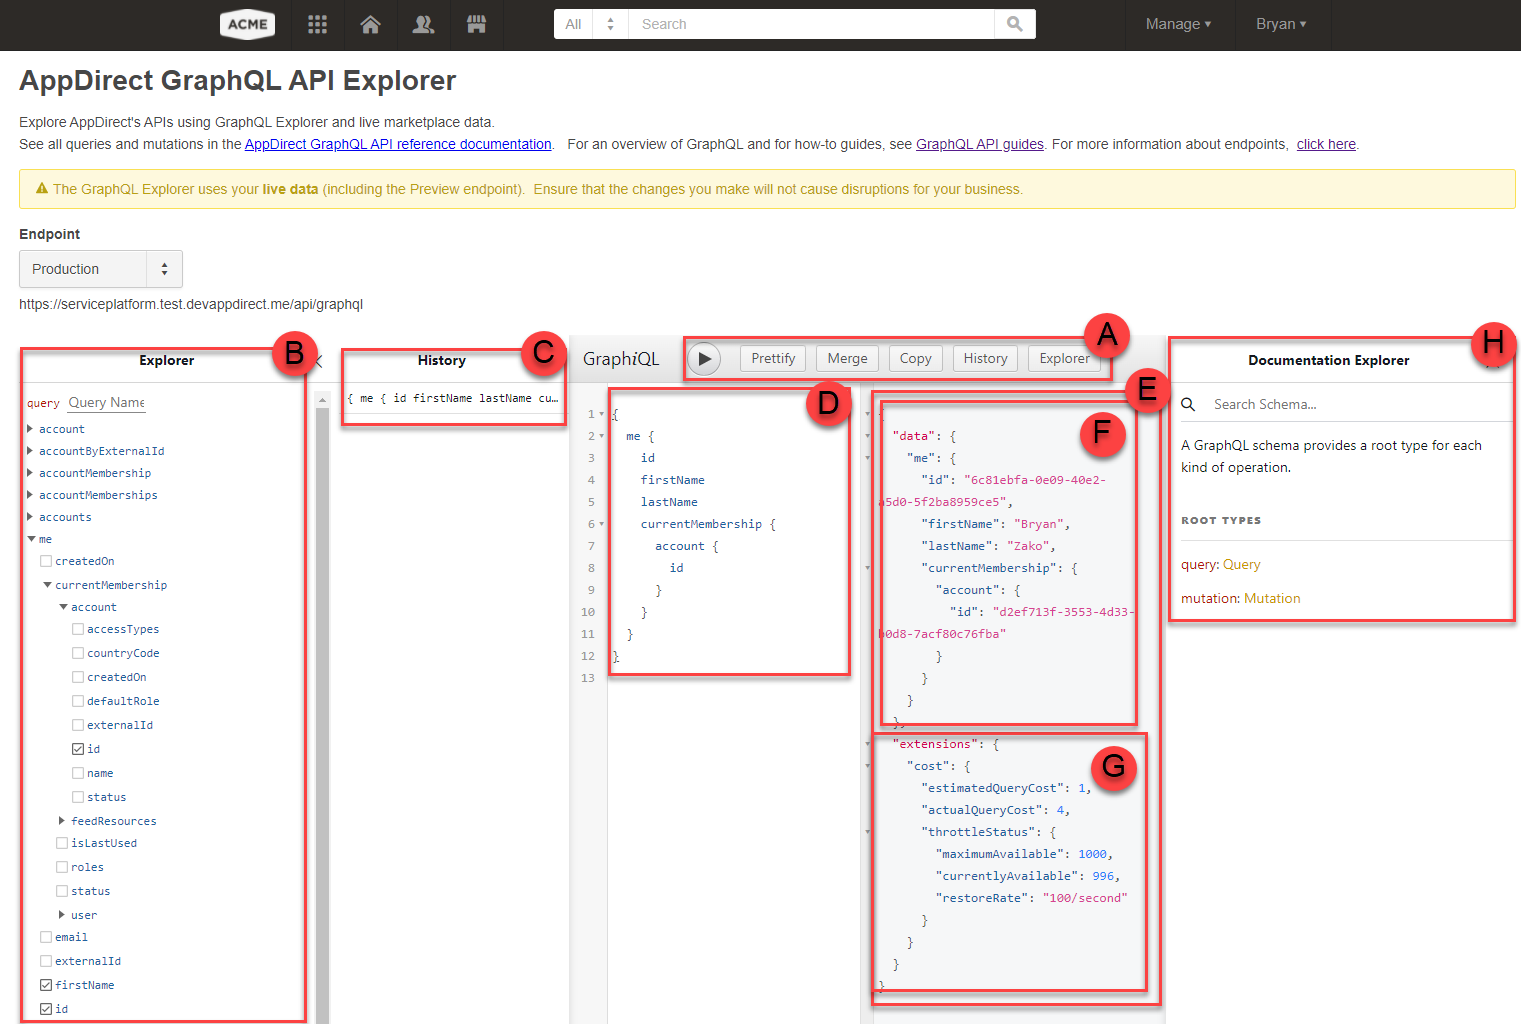
A: Commands, B: Explorer pane, C: History pane, D: Query pane, E: Response pane, F: Data, G: Extensions, H: Documentation Explorer pane
Commands
EXECUTE
Play executes the items that you built and appear in the Query pane. The results appear in the Response pane.
If there is more than one item in the Query pane, you are asked to select one.
PRETTIFY
Prettify removes spaces and extra lines, fixes indentations, and visually 'prettifies' the query in the Query pane.
It is not necessary to prettify your query. The command only makes the query more readable and does not affect execution.
MERGE
Merge refactors the item. That is, it flattens the item with defined fragments. It is different from Prettify, which retains the original item but simply fixes indentations, removes extra lines, removes spaces, and otherwise makes the item more readable.
COPY
The selected text in the Query pane is copied to a clipboard that can then be pasted (to paste CMD- or CTRL-V).
HISTORY
History populates the History pane with a list of previously executed queries and mutations. You can select and re-execute any of them.
EXPLORER
Explorer populates the GraphQL Explorer pane with an interactive checkbox tool that you can use to build queries and mutations. As you check fields, the queries or mutations appear in the adjacent Query pane.
GraphQL Explorer window
Explorer
The Explorer pane uses the Introspection tool of the graph to:
-
display a list of all queries and mutations along with the available return fields
-
allow you to build valid, executable queries and mutations interactively
At the bottom of the Explorer section there is an Add new dropdown list with two options: Query and Mutation. To add a new query or mutation, select the type of operation in this list and click the + sign that appears to its right. This adds a new item in the Explorer and Query panes. You can then build the item using the Explorer pane.
To build queries and mutations, select the query or mutation that you want to execute in the Explorer pane. Then, select the checkboxes for the fields from which you want to retrieve data, or to which you want to apply changes. Based on your selections, Explorer generates a valid, executable query, or mutation, that appears in the Query pane.
History
The History pane displays a list of previously executed queries and mutations, any of which can now be selected then re-executed, is displayed. The History pane is activated by clicking the HISTORY button.
Query
The Query pane displays the queries and mutations you build. The fields to be queried can be manually entered and edited in the Query pane, or can be selected through checkboxes in the adjacent Explorer window.
Response
The Response pane displays the response to the executed query or mutation. Query and mutation responses consist of two parts:
Data
This part of the response displays the actual returned data to the executed query.
Extension
This part of the response displays the data cost of a query. This is Also known as the Rate Limitation. Rate limits define the maximum number of points that are allowed by a client application per minute, using a leaky bucket algorithm. Usage of a leaky bucket algorithm allows client applications to make an unlimited number of requests over a large time horizon but protects against excessively large bursts over a short one.
The current bucket size is 1000, with a leak rate of 100 points per second. This means that at any given time the cost of queries cannot exceed 1000 points and room is created in the bucket at a rate of 100 points per second.
Documentation Explorer
You can search the Documentation Explorer for queries, mutations, and object types.
Documentation Explorer is a feature inside GraphQL Explorer that is built on top of Introspection and provides access to documentation of all queries and all mutations. Through the selected endpoint, Documentation Explorer will automatically use the AppDirect Introspection feature and will display a list of all queries, mutations, their descriptions, and their available return fields. Changing the endpoint will change the displayed inventory of queries and mutations.
Was this page helpful?
Tell us more…
Help us improve our content. Responses are anonymous.
Thanks
We appreciate your feedback!